python
14 lines · 1 tab
Dr. Elena Vasquez
Apr 2026
1 tab
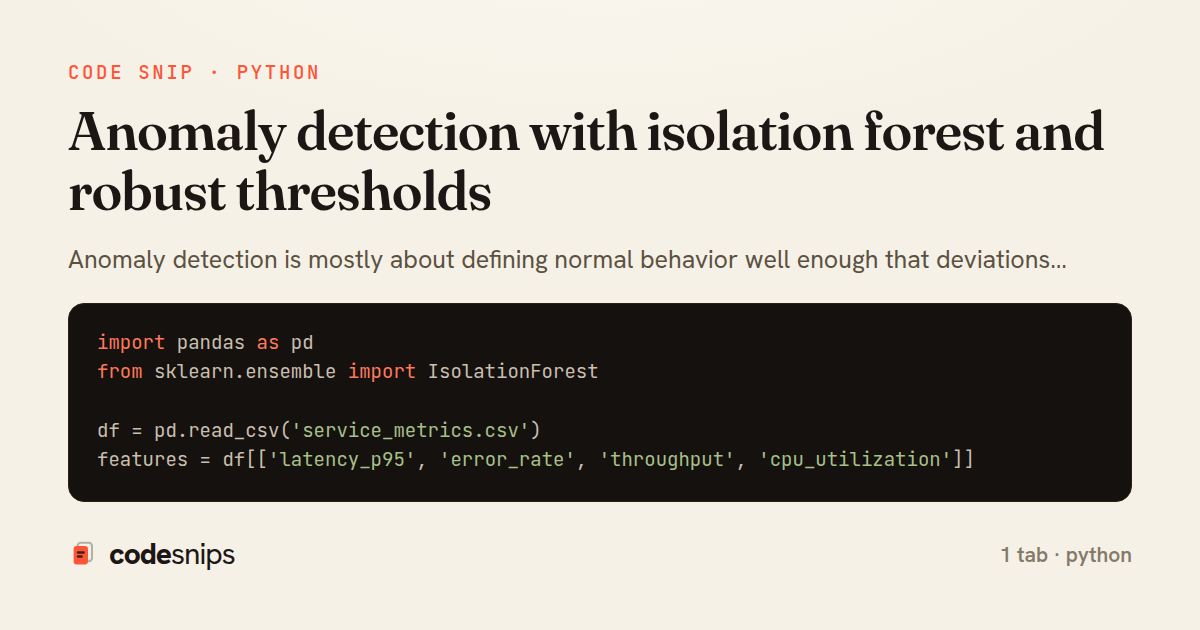
import pandas as pd
from sklearn.ensemble import IsolationForest

df = pd.read_csv('service_metrics.csv')
features = df[['latency_p95', 'error_rate', 'throughput', 'cpu_utilization']]

detector = IsolationForest(
    n_estimators=300,
    contamination=0.02,
    random_state=42,
)
df['anomaly_score'] = detector.fit_predict(features)
anomalies = df[df['anomaly_score'] == -1]
print(anomalies.head())
1 file · python
Explain with highlit
Anomaly detection is mostly about defining normal behavior well enough that deviations matter. I usually combine a model like IsolationForest with feature windows and operational thresholds that the business can interpret. Without that calibration, anomaly alerts just become background noise.
Related snips
yaml
# Grafana provisioning: datasources
# /etc/grafana/provisioning/datasources/prometheus.yml
apiVersion: 1
datasources:
  - name: Prometheus
    type: prometheus
Grafana dashboards as code with JSON provisioning
grafana
dashboards
monitoring
by Ryan Nakamura
2 tabs
ruby
require "timeout"

module HealthCheck
  class Probe
    Result = Struct.new(:name, :status, :latency_ms, :critical, :error, keyword_init: true) do
      def healthy?
Health Check Endpoint with Dependency Probes
rails
reliability
health-check
by codesnips
3 tabs
typescript
import { onCLS, onINP, onLCP, onFCP, onTTFB, type Metric } from 'web-vitals';

export interface VitalPayload {
  id: string;
  name: Metric['name'];
  value: number;
Web Vitals reporting to an API endpoint
performance
observability
react
by codesnips
3 tabs
typescript
import { Registry, Histogram, Counter, collectDefaultMetrics } from 'prom-client';

export const register = new Registry();

collectDefaultMetrics({ register });
Prometheus metrics for request latency
observability
node
metrics
by codesnips
3 tabs
sql
-- Enable pg_stat_statements extension
CREATE EXTENSION IF NOT EXISTS pg_stat_statements;

-- postgresql.conf:
-- shared_preload_libraries = 'pg_stat_statements'
-- pg_stat_statements.track = all
Query performance monitoring and profiling
database
monitoring
performance
by Maria Garcia
2 tabs
python
import requests

response = requests.get('https://crt.sh/', params={'q': '%.example.com', 'output': 'json'}, timeout=15)
response.raise_for_status()
certs = response.json()
print(certs[:5])
Certificate transparency checks for unexpected certificate issuance
certificate-transparency
tls
monitoring
by Kai Nakamura
1 tab
Share this code
Here's the card — post it anywhere.