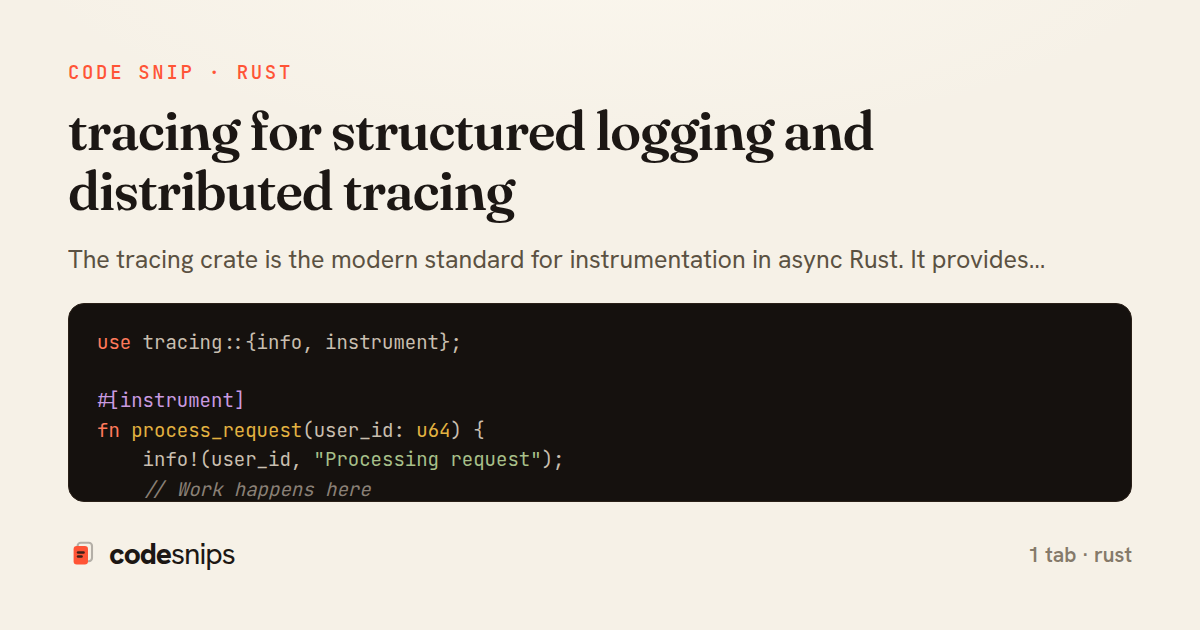
use tracing::{info, instrument};

#[instrument]
fn process_request(user_id: u64) {
    info!(user_id, "Processing request");
    // Work happens here
}

fn main() {
    tracing_subscriber::fmt::init();
    process_request(42);
}
The tracing crate is the modern standard for instrumentation in async Rust. It provides structured logging with spans (representing work) and events (point-in-time records). Spans can be nested, creating a tree that represents causality. I instrument functions with #[instrument], which auto-generates span entry/exit. Subscribers (like tracing-subscriber) format and output events. For distributed tracing, tracing-opentelemetry exports spans to Jaeger or Honeycomb. The key advantage over traditional logging is structured fields (info!(user_id = %id)), which are queryable in log aggregators. Tracing integrates seamlessly with tokio and axum, making it easy to add observability to async services. I use it in every production service.
Related snips
package api

import (
  "net/http"
  "runtime/debug"
)
Expose build metadata for debugging deploys
struct Config<'a> {
    name: &'a str,
    value: &'a str,
}

fn parse_config(line: &str) -> Config {
Lifetime annotations for flexible borrowing in structs
use crossbeam::channel::unbounded;
use std::thread;

fn main() {
    let (tx, rx) = unbounded();
Crossbeam for advanced concurrent data structures
use std::sync::mpsc;
use std::thread;

fn main() {
    let (tx, rx) = mpsc::channel();
Channels (mpsc) for message passing between threads
use clap::Parser;

#[derive(Parser, Debug)]
#[command(author, version, about)]
struct Args {
    #[arg(short, long)]
clap for CLI argument parsing with derive macros
macro_rules! create_function {
    ($func_name:ident) => {
        fn $func_name() {
            println!("Called {}", stringify!($func_name));
        }
    };
Declarative macros (macro_rules!) for code generation
Share this code
Here's the card — post it anywhere.