python
10 lines · 1 tab
Dr. Elena Vasquez
Apr 2026
1 tab
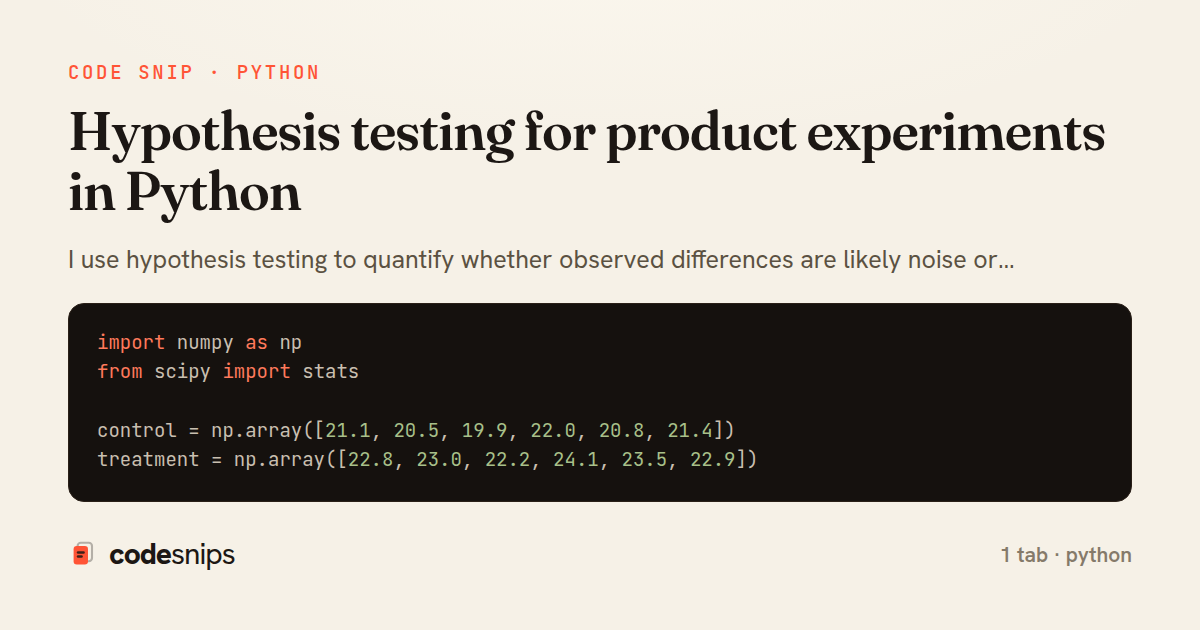
import numpy as np
from scipy import stats

control = np.array([21.1, 20.5, 19.9, 22.0, 20.8, 21.4])
treatment = np.array([22.8, 23.0, 22.2, 24.1, 23.5, 22.9])

statistic, p_value = stats.ttest_ind(treatment, control, equal_var=False)
uplift = treatment.mean() - control.mean()

print({'uplift': round(float(uplift), 3), 'p_value': round(float(p_value), 6)})
1 file · python
Explain with highlit
I use hypothesis testing to quantify whether observed differences are likely noise or signal, but I keep the business context attached. A tiny p-value without practical effect size is not a win. The code should make assumptions visible: sample sizes, equal variance choices, and the metric definition itself.
Related snips
python
import pandas as pd
import seaborn as sns
import matplotlib.pyplot as plt

train_df = pd.read_parquet('train_features.parquet')
prod_df = pd.read_parquet('production_features.parquet')
Statistical visualizations for distribution and drift analysis
seaborn
data-drift
distributions
by Dr. Elena Vasquez
1 tab
python
import numpy as np
from statsmodels.stats.proportion import proportions_ztest, confint_proportions_2indep

control_conversions = 920
control_users = 12_500
treatment_conversions = 1_015
A B testing analysis with confidence intervals and guardrails
ab-testing
experimentation
statistics
by Dr. Elena Vasquez
1 tab
ruby
class FeatureFlag < ApplicationRecord
  validates :key, presence: true, uniqueness: true
  validates :percentage,
            numericality: { only_integer: true,
                            greater_than_or_equal_to: 0,
                            less_than_or_equal_to: 100 }
Percentage-Based Feature Flag Rollout With a Stable Bucketing Gate in Rails
rails
feature-flags
rollout
by codesnips
4 tabs
typescript
export const FLAG_REGISTRY = {
  newDashboard: {
    default: false as boolean,
    description: 'Renders the redesigned dashboard shell',
  },
  maxUploadMb: {
Feature flags with a typed registry
typescript
feature-flags
react
by codesnips
3 tabs
Share this code
Here's the card — post it anywhere.