python
22 lines · 1 tab
Dr. Elena Vasquez
Apr 2026
1 tab
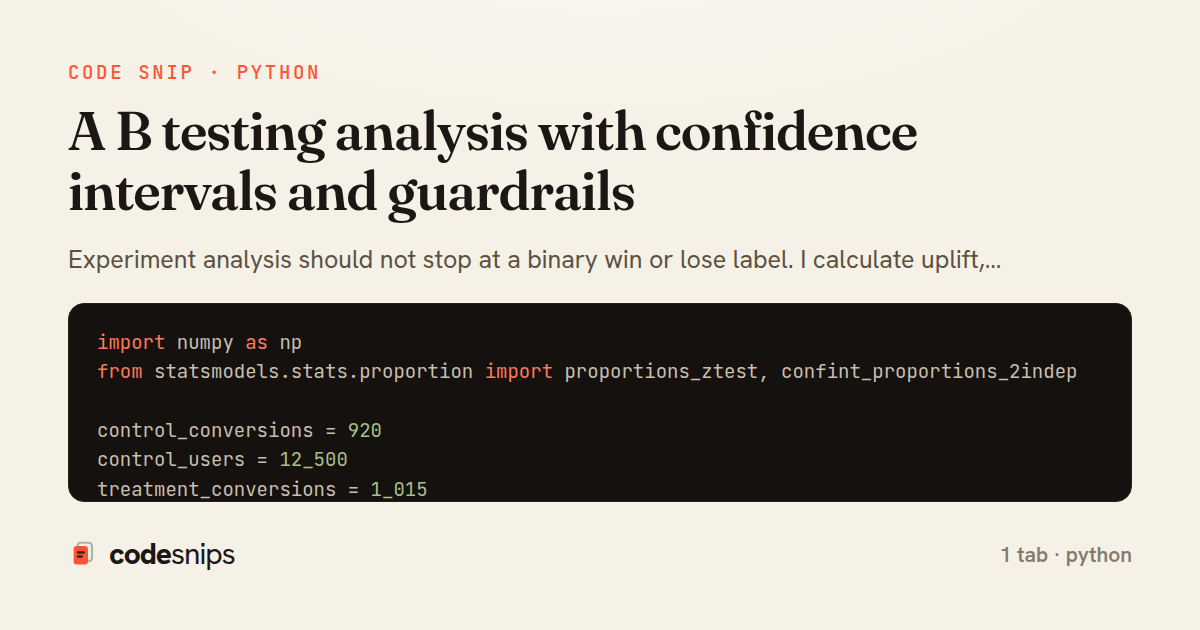
import numpy as np
from statsmodels.stats.proportion import proportions_ztest, confint_proportions_2indep

control_conversions = 920
control_users = 12_500
treatment_conversions = 1_015
treatment_users = 12_430

z_stat, p_value = proportions_ztest(
    count=[treatment_conversions, control_conversions],
    nobs=[treatment_users, control_users],
)

ci_low, ci_high = confint_proportions_2indep(
    count1=treatment_conversions,
    nobs1=treatment_users,
    count2=control_conversions,
    nobs2=control_users,
    method='wald',
)

print({'z_stat': float(z_stat), 'p_value': float(p_value), 'ci': [float(ci_low), float(ci_high)]})
1 file · python
Explain with highlit
Experiment analysis should not stop at a binary win or lose label. I calculate uplift, confidence intervals, and guardrail metrics like latency or refund rate before recommending rollout. The point of the analysis is decision quality, not statistical theater.
Related snips
python
import pandas as pd
import seaborn as sns
import matplotlib.pyplot as plt

train_df = pd.read_parquet('train_features.parquet')
prod_df = pd.read_parquet('production_features.parquet')
Statistical visualizations for distribution and drift analysis
seaborn
data-drift
distributions
by Dr. Elena Vasquez
1 tab
python
import numpy as np
from scipy import stats

control = np.array([21.1, 20.5, 19.9, 22.0, 20.8, 21.4])
treatment = np.array([22.8, 23.0, 22.2, 24.1, 23.5, 22.9])
Hypothesis testing for product experiments in Python
statistics
hypothesis-testing
scipy
by Dr. Elena Vasquez
1 tab
ruby
class FeatureFlag < ApplicationRecord
  validates :key, presence: true, uniqueness: true
  validates :percentage,
            numericality: { only_integer: true,
                            greater_than_or_equal_to: 0,
                            less_than_or_equal_to: 100 }
Percentage-Based Feature Flag Rollout With a Stable Bucketing Gate in Rails
rails
feature-flags
rollout
by codesnips
4 tabs
typescript
export const FLAG_REGISTRY = {
  newDashboard: {
    default: false as boolean,
    description: 'Renders the redesigned dashboard shell',
  },
  maxUploadMb: {
Feature flags with a typed registry
typescript
feature-flags
react
by codesnips
3 tabs
Share this code
Here's the card — post it anywhere.